Single Winner Voting Systems
I became interested in voting systems after watching Veritsium's Why Democracy is Mathematically Impossible. The video inspired me to create an interactive demo. It effectively demonstrates the spoiler effect, which I will explain. Feel free to try it out of follow along. You can move the candidates around by clicking and dragging them, and adjust the conditions and election method with the menu on the left.
In the simulation, the voters and candidates are layed out on a 2D plane, and voters vote based on geometric distance. When I refer to voter preferences later in the article, that is what I mean.
Plurality
Plurality voting is the simplest method. Each voter simply casts a vote for the closest candidate, and the votes are counted. This may seem like a straightforward method, but it two major flaws. First, a candidate can win with a relatively small proportion of the vote. Second, plurality voting suffers from the spoiler effect.
In order to illustrate these flaws, go to the interactive demo. Using the menu, select a bimodal distribution and two candidates. Move green to the upper left-hand corner as far as you can, and move red to the middle of the bottom-right cluster. Move the number of voters to 1000, and the number of candidates to 2. You should see something like this:
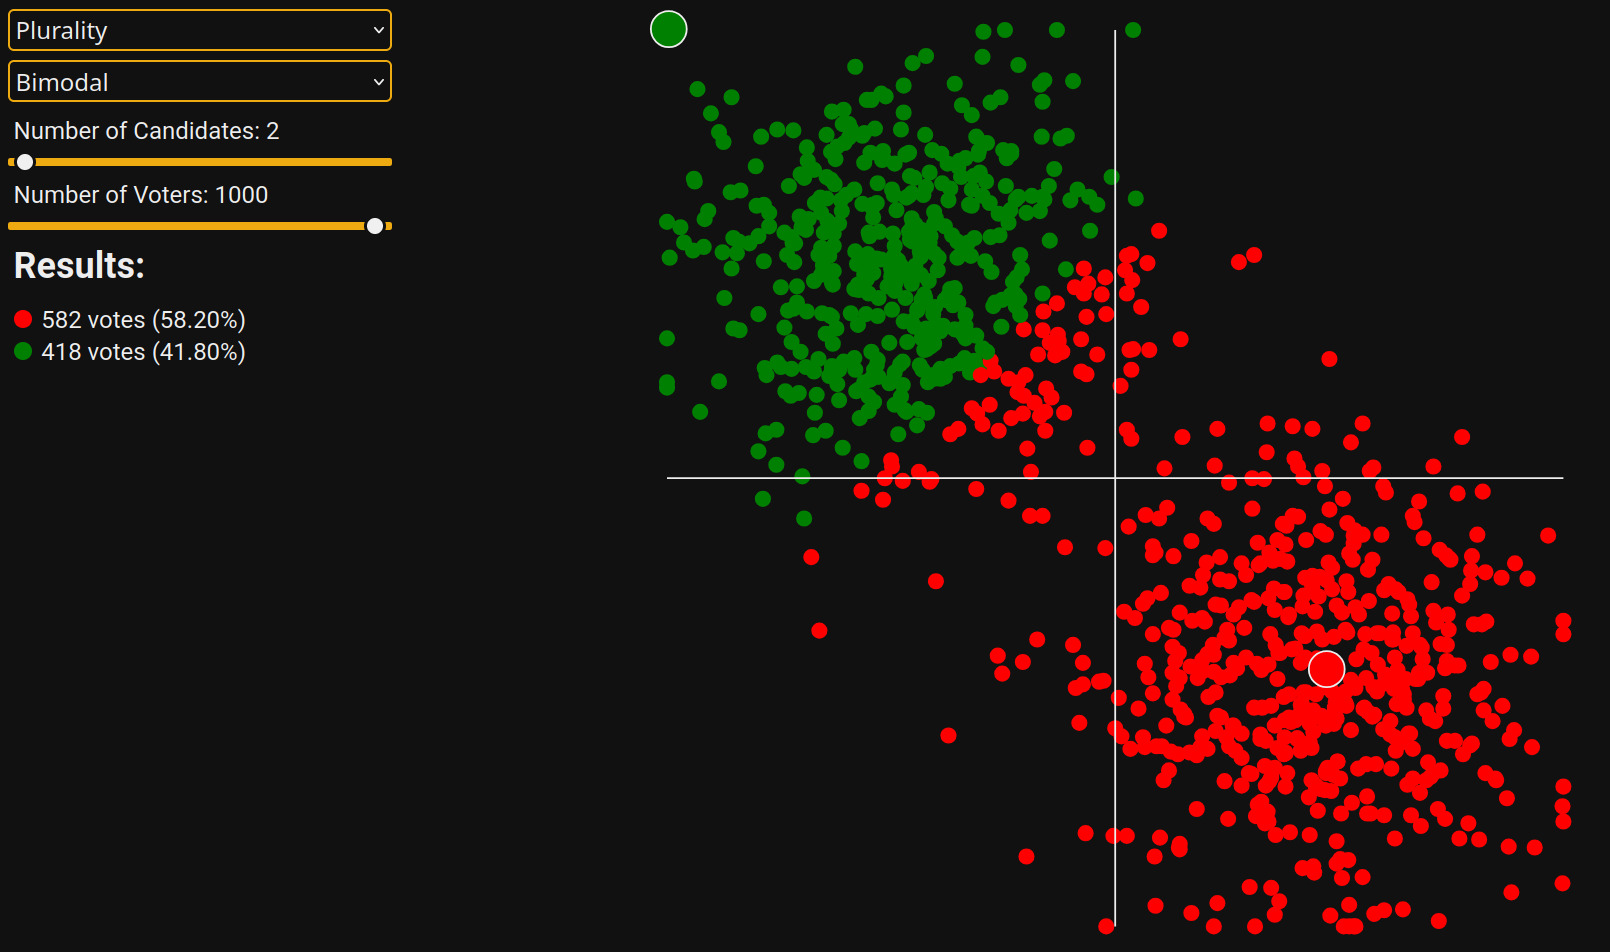
As one would expect, Red wins by a comfortable margin, since Green is off in the fringes.
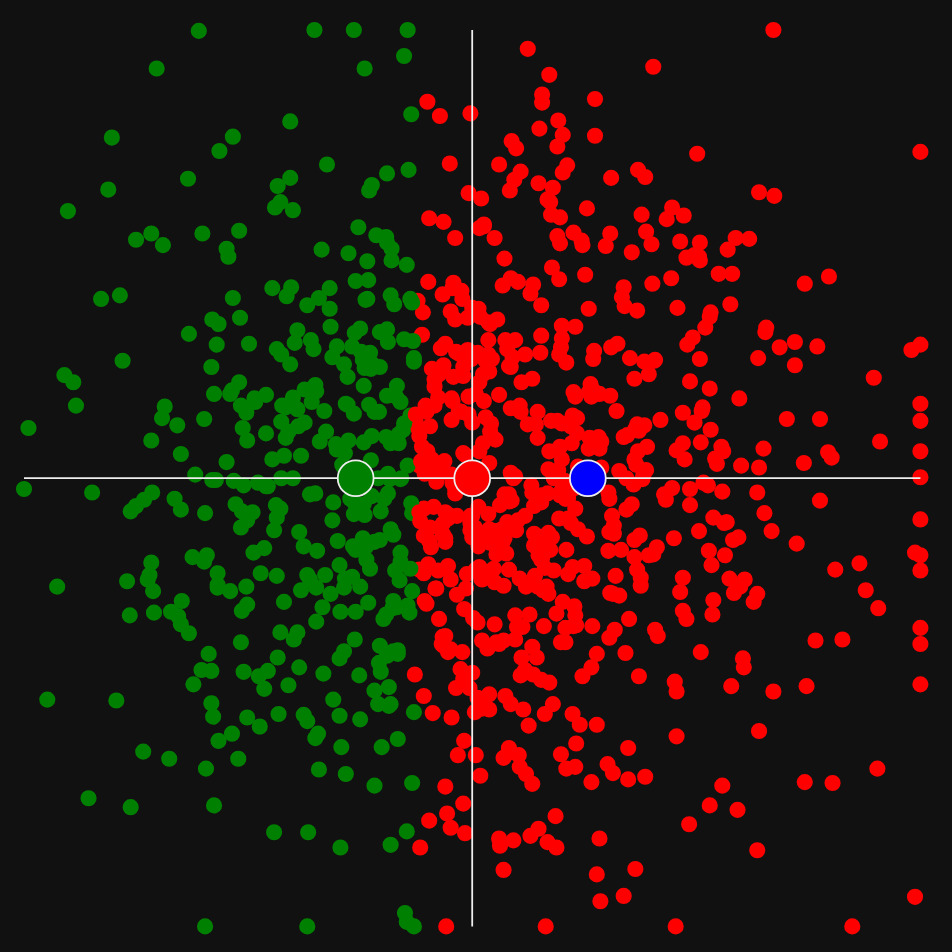
To illustrate what can go wrong, add a third candidate (this one should be Blue). Move Blue close to Red. You should see something like this:
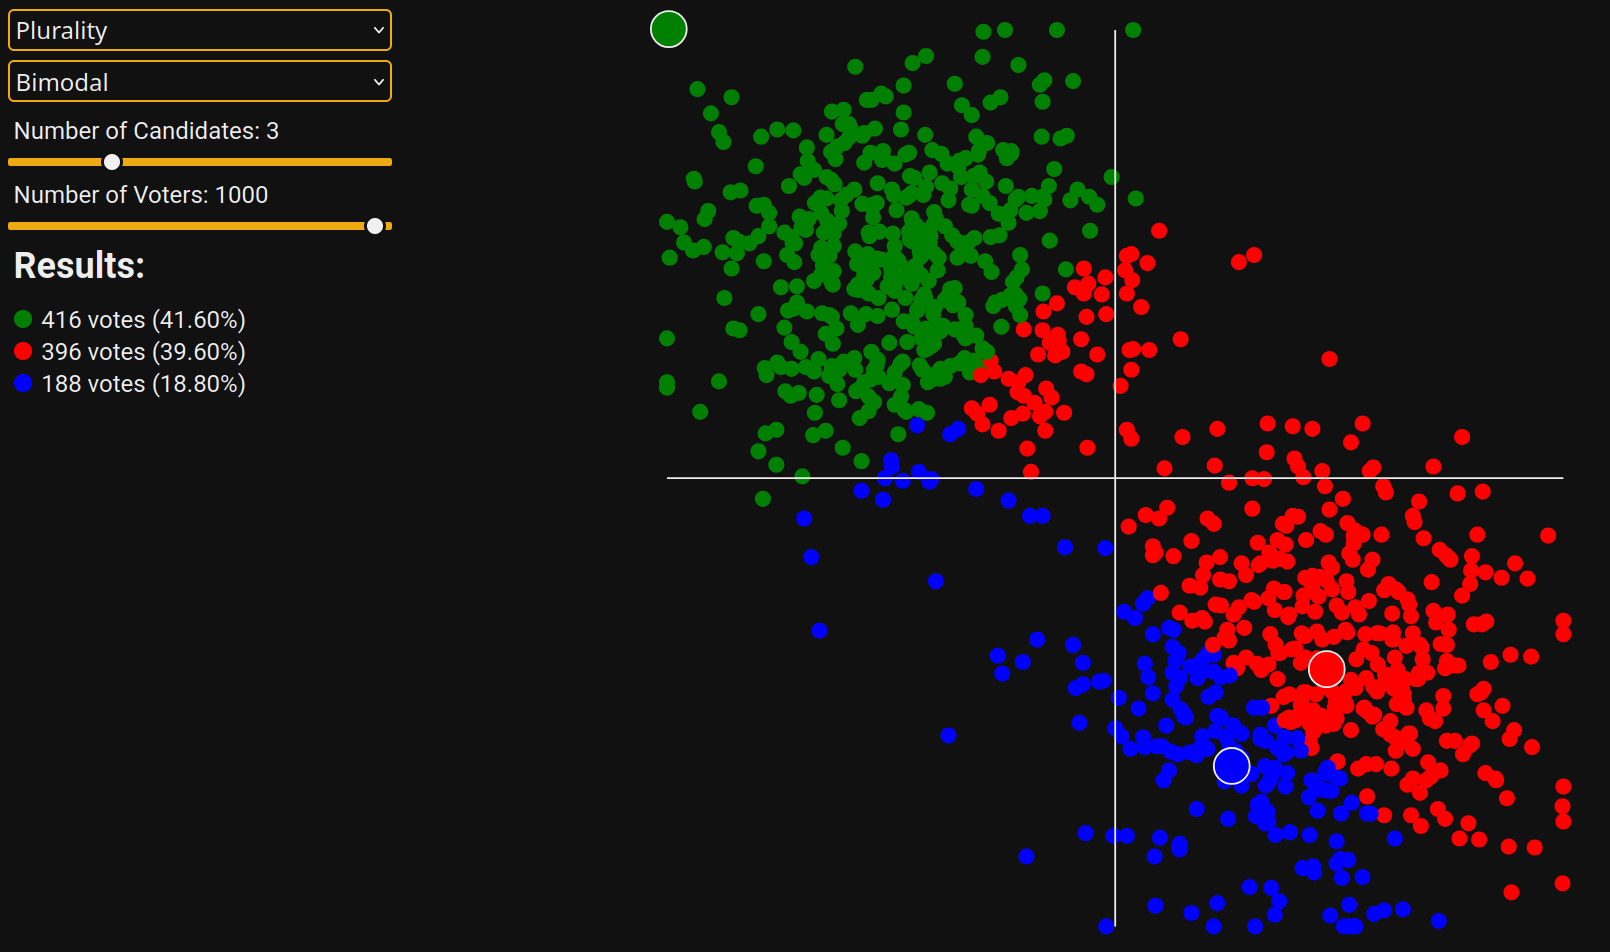
Green—a fringe candidate&emdash;wins, even though both Red and Blue are closer to the average voter. Red and Blue have spoiled one another. Green also wins with only 43% of the vote.
Instant Runoff
Instant Runoff voting (IRV), also sometimes called Ranked Choice voting, is an alternative system. In IRV, each voter turns in a ballot providing a ranking of all candidates from most to least preferred. Then, a series of runoffs occur. In the first runoff, each voter's vote is cast for his or her most preferred candidate as in plurality voting. If any candidate gest a strict majority (more than 50% of the vote), then that candidate is declared the winner. Otherwise, the candidate with the least number of votes is eliminated and those who chose that candidate as their first choice have their vote cast for their second choice instead.
From here, the process repeats. If in any runoff a candidate gets a strict majority, he or she is declared the winner. Otherwise, the process continues. Eventually, there will only be two candidates left, in which case we are back to a simple plurality election. The interactive demo allows you to click through runoffs in order to get a feel for the process.
While proposed as an improvement to plurality voting, IRV also suffers from the spoiler effect. See for yourself: select two candidates, 1000 voters, and a normal distribution of voters. Place one candidate at the center of the mass of voters, and one slightly outside.
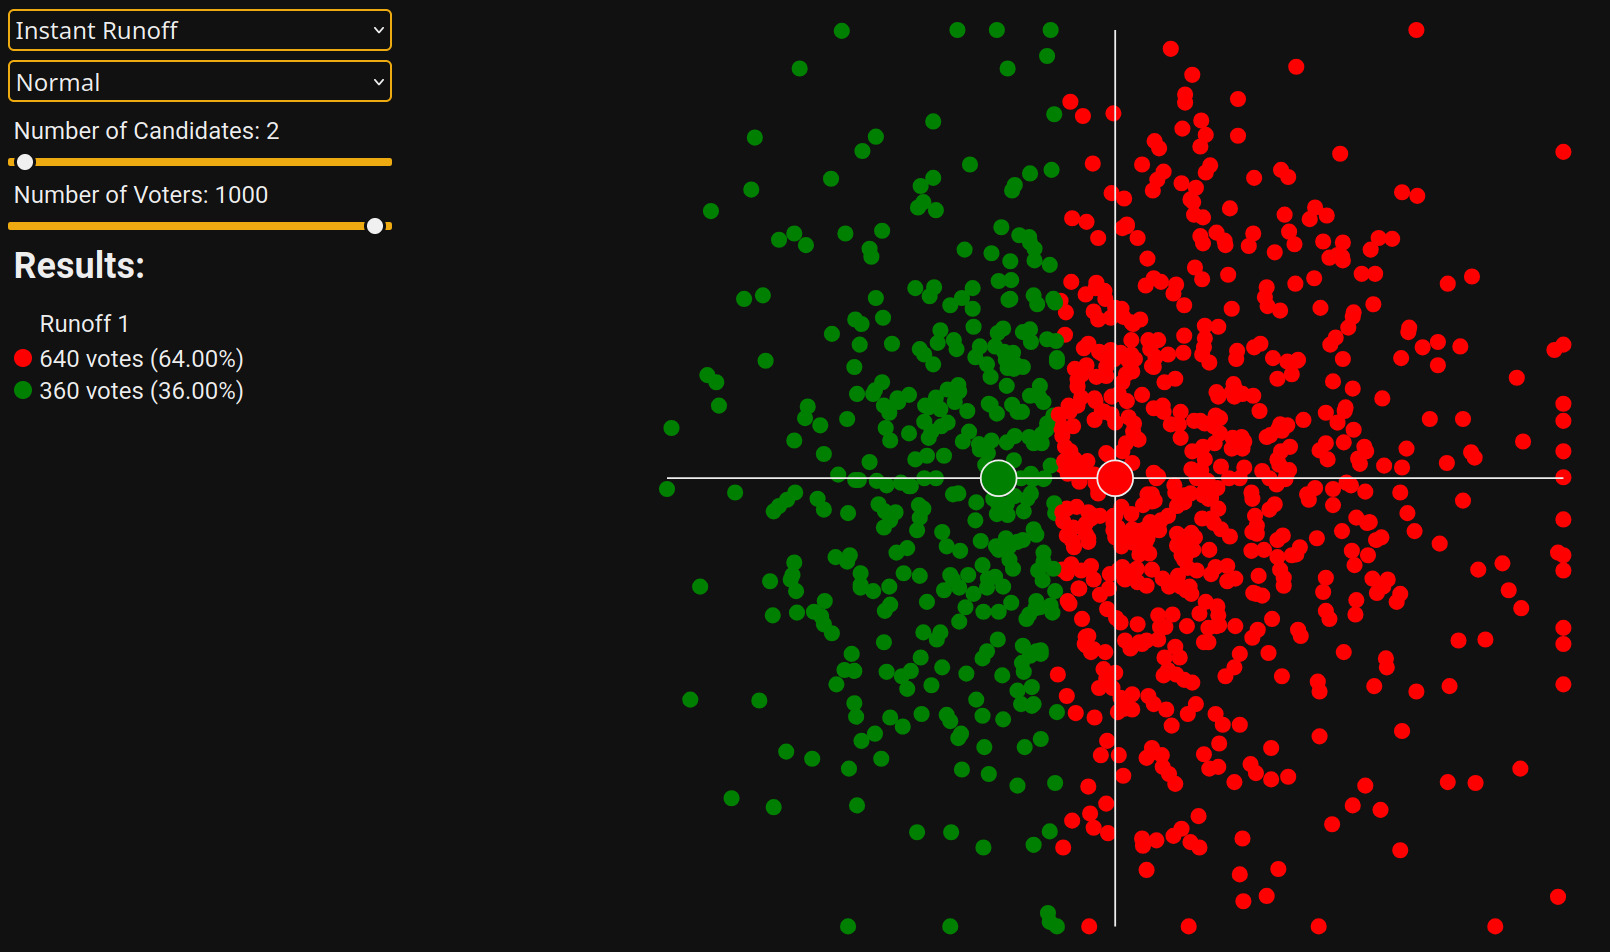
Naturally, Red wins with a healthy margin.
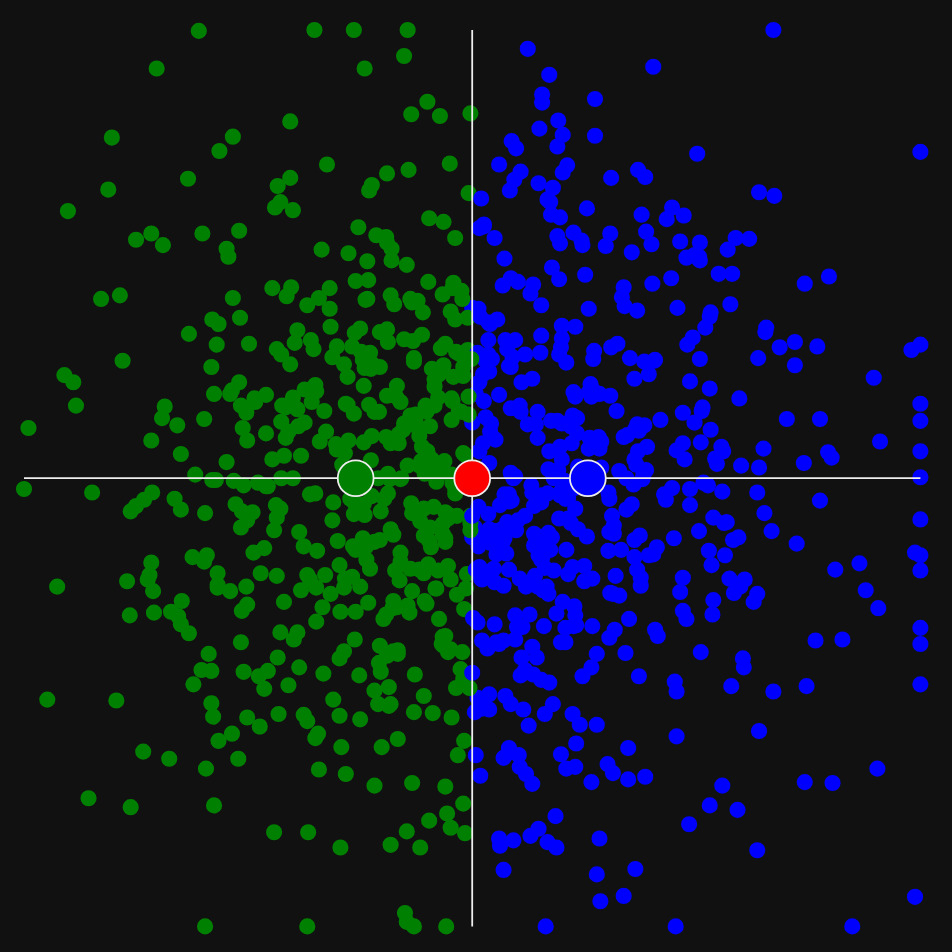
Now, let's try three candidates. We will put Blue opposite Green:
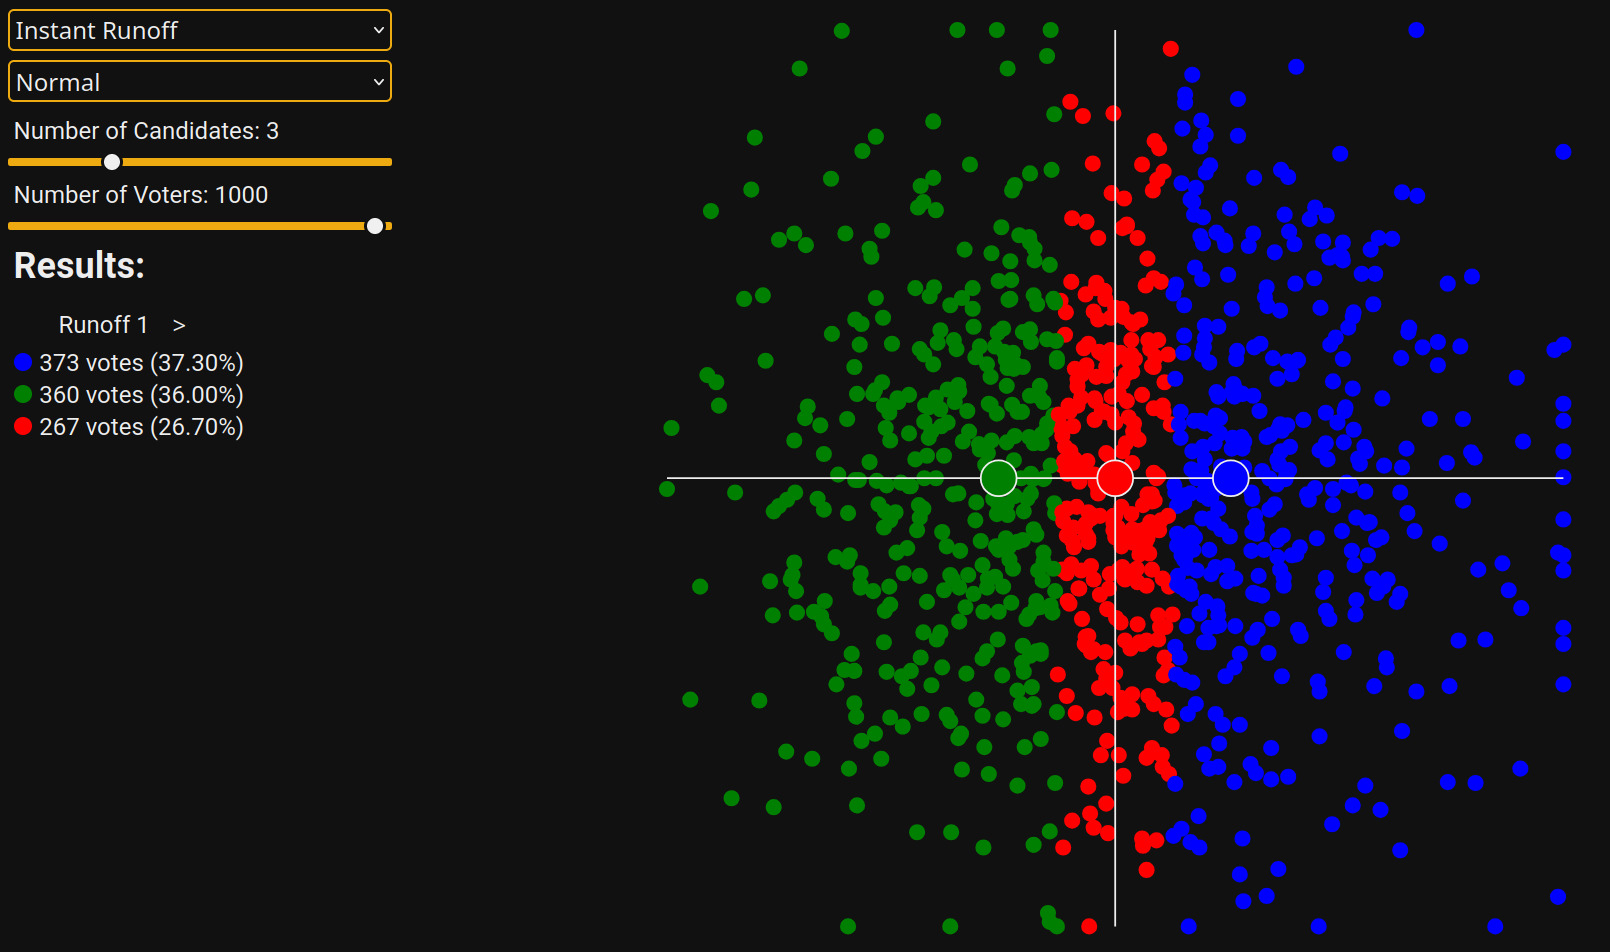
In the first runoff, Red (the candidate closest to the average voter) is eliminated! Here is the next runoff:
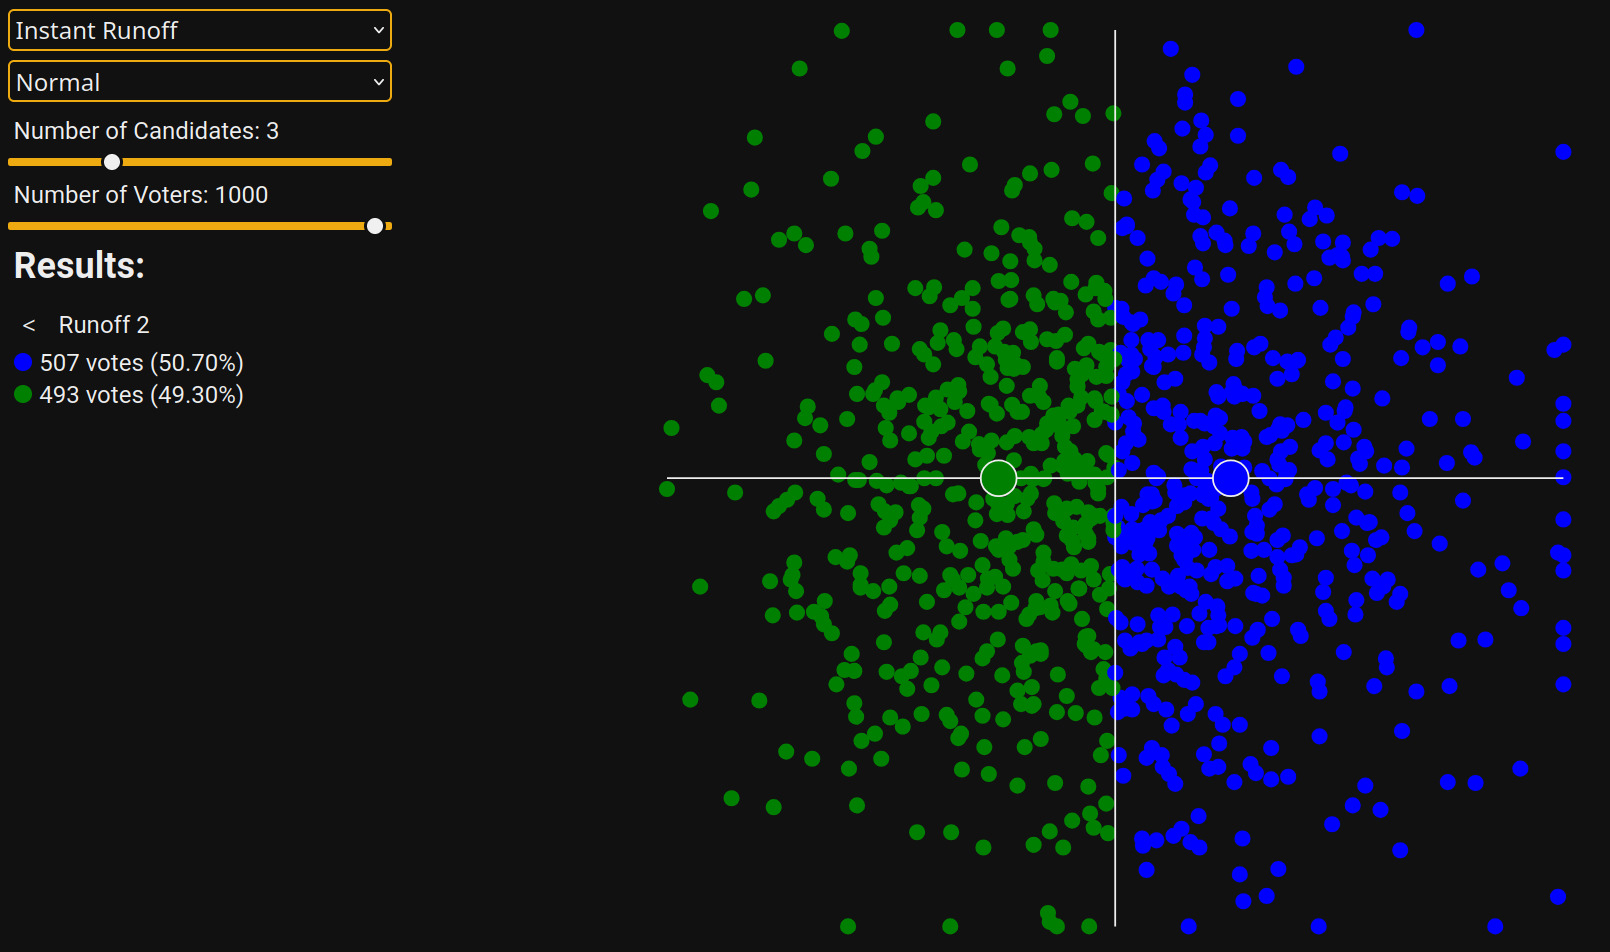
Now, Green wins. If you put Green and Blue in slightly different places than me, you might see Blue win, but Red always loses. This is the spoiler effect.
Interlude
The next sections will cover Approval Voting and Condorcet Methods. These methods are not susceptible to the spoiler effect, so I will focus on how they avoid the issues we have seen above. Each has a flaw of its own, but they are harder to illustrate with the current demo, so they will have to wait for a later article.
Approval
Approval Voting is a system in which voters receive a ballot with the option to vote either approve or disapprove, hence the name. The winning candidate is simply the one who receives the most approvals.
The visualization for Approval Voting is different: since voters may vote for multiple candidates, it is not clear which color to draw. Instead, a circle is drawn around each candidate indicating approval radius, i.e., the area in which voters will vote for that candidate. The winners are still listed on the left in the Results section.
Here is the first election from the Plurality section, this time with Approval scoring:
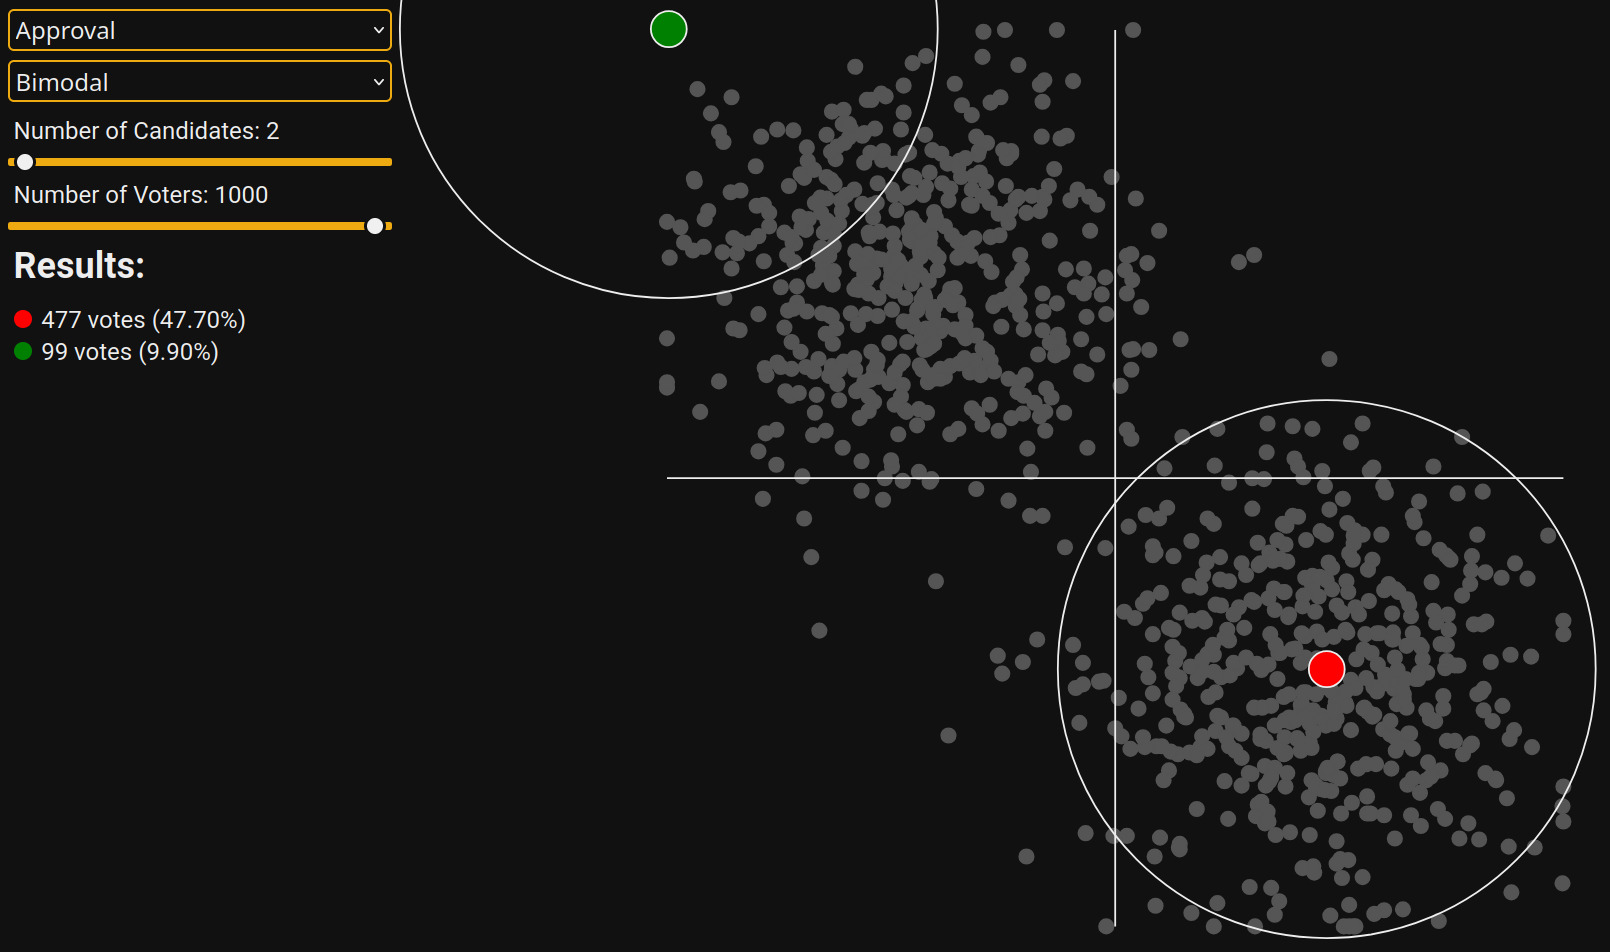
Red wins again, but that is no surprise. The result was the same in Plurality.
But if we put Blue back in, then Red still wins if it is closer to its cluster than Blue.
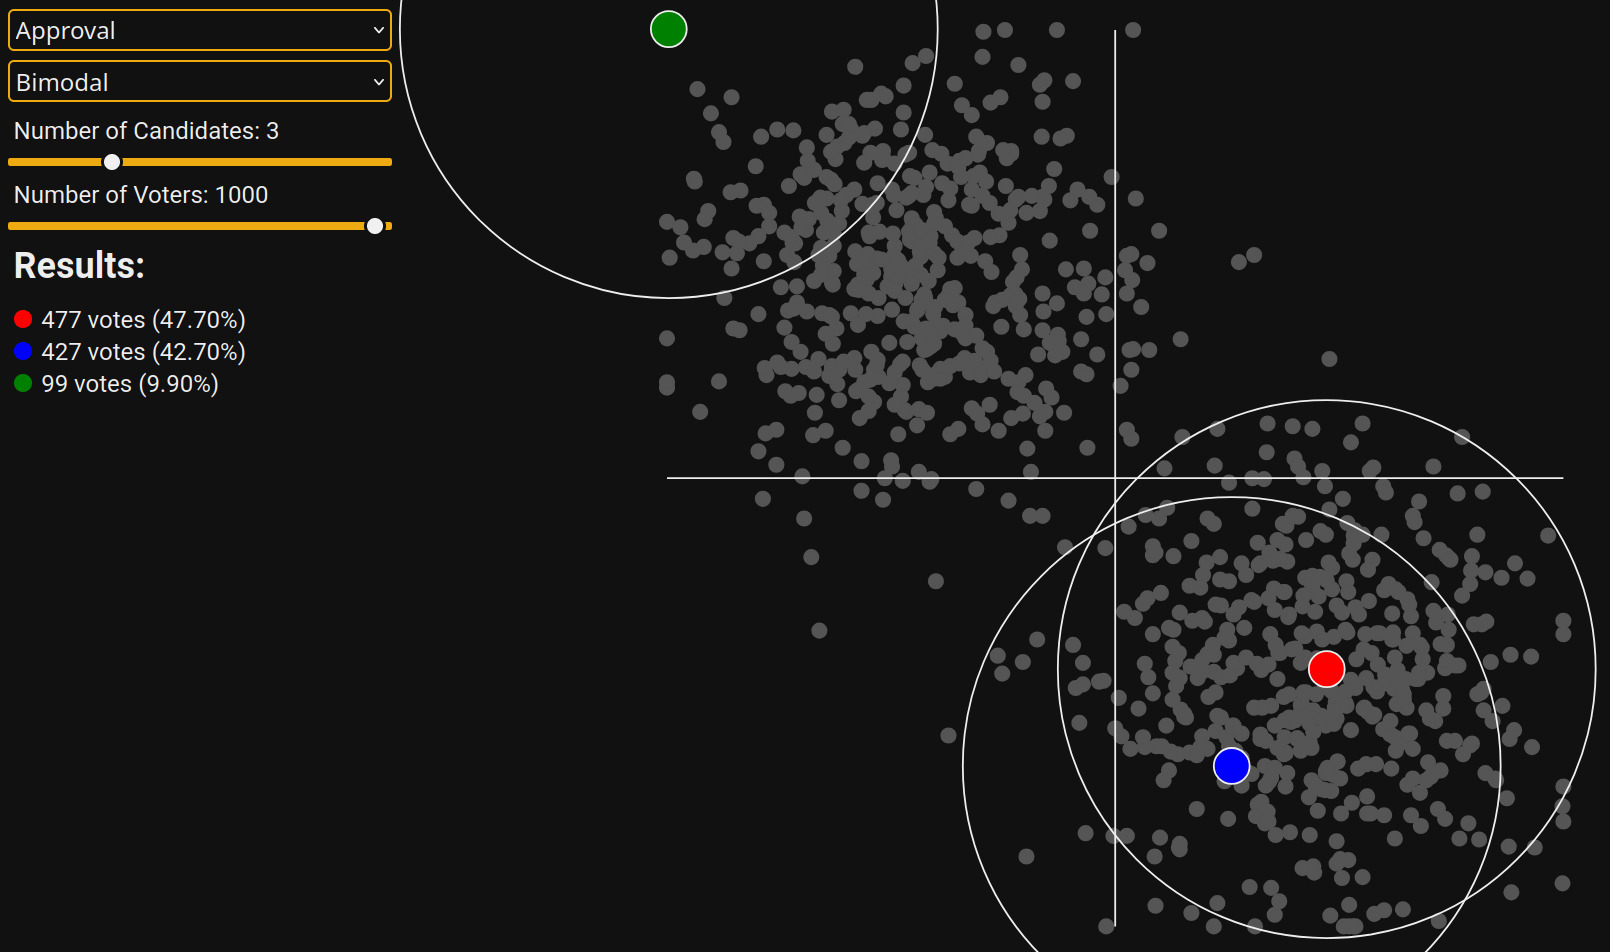
In the Plurality section, Green won this election.
Condorcet Methods
Condorcet Methods are a family of voting methods that satisfy Condorcet criterion. The Condorcet criterion is a ground-truth for determining which candidate is preferred by the majority. It says that one should first run a series of head-to-head elections between each possible pair of candidates. If there is any candidate who wins every head-to-head election, then that candidate is the Condorcet winner. Any voting method which chooses the Condorcet winner when there exists one is called a Condorcet method. In practice, a Condorcet election resembles a round-robin tournament between candidates.
One may wonder why there are so many methods all for one simple criterion? The answer is that there is not guarenteed to be a Condorcet winner in any given election. It may be that there is a sort of rock-paper-scissors situation: Candidate 1 is preferred to Candidate 2, Candidate 2 is preferred to Candidate 3, and Candidate 3 is preferred to Candidate 1. In that case, a tie-breaker is necessary, and there are many options. One simple solution is minimax: the candidate who lost a head-to-head election by the smallest number of votes is declared the winner. Another option is to fall back to instant runoff. Others are more complicated.
As it turns out, this will never occur in my simulation: when voters and candidates are layed out in space and voters vote based on geometric distance, they will always have preferences that produce a Condorcet winner. However, the Condorcet method can be used to evaluate other methods since it provides a ground-truth about majority preferred candidates. In my simulation, selecting the Condorcet option provides a table in the results section with head-to-head scores. You can click on any score and see the head-to-head results on the plane.
To show how Condorcet Methods fix the issues with others, let's replay the Instant Runoff election from earlier with. The Condorcet simulation produces a table of outcomes, which list the margin of victory in each head-to-head election. You can click on a cell to see head-to-head results. Here are the table and all three head-to-head elections:
| 0 | 254 | 280 | |
| -254 | 0 | 14 | |
| -280 | -14 | 0 |
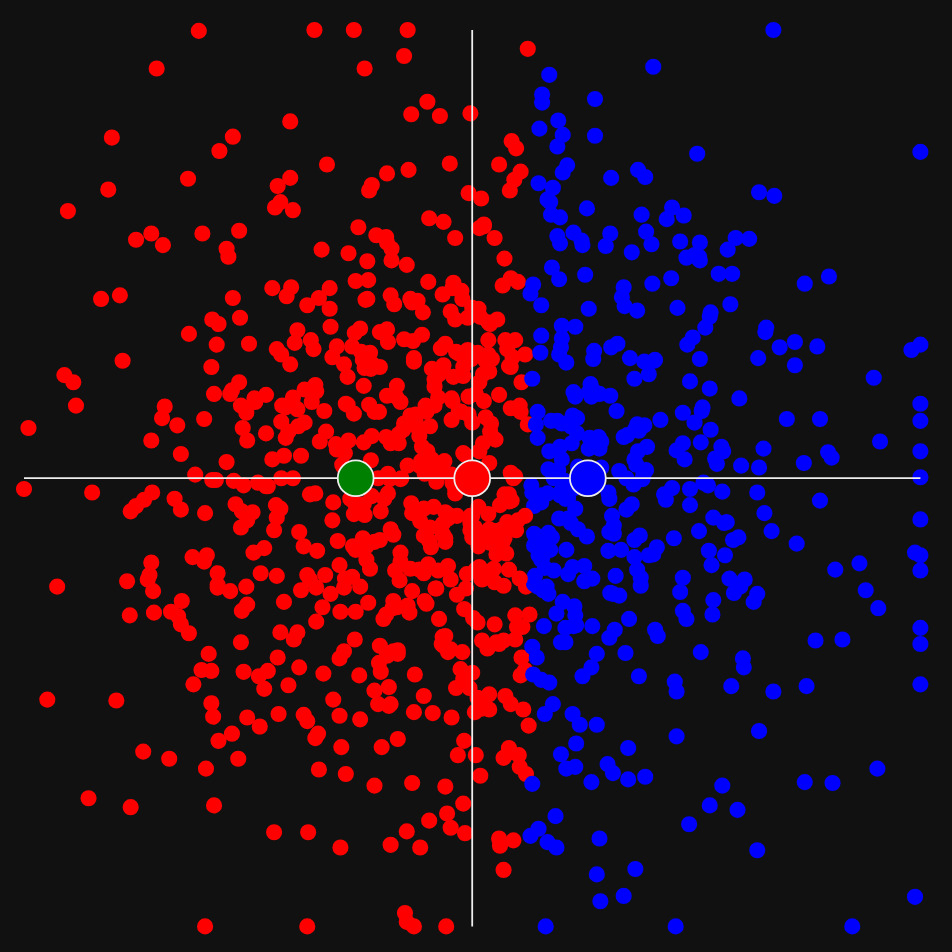
Red wins both head-to-head election and therefore the election as a whole, with no spoilage. The Blue vs. Green head-to-head places Blue in second, but the result is irrelevant since Red is the clear winner.